Course overview
Description generated based on course syllabus and open data.
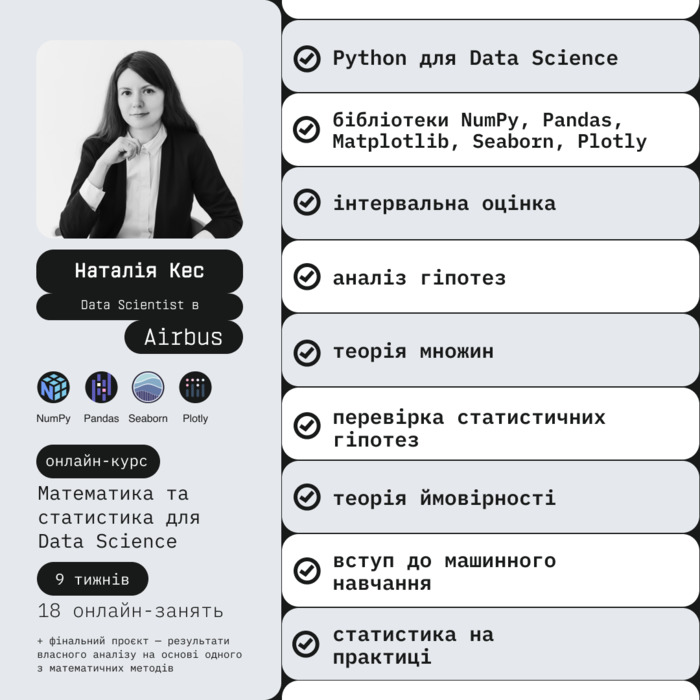
Lecturer: Nataliia Kees — Data Scientist at Airbus with 5+ years of experience. Works with NLP, search systems, and intelligent assistants. The format uses Jupyter Notebook with Pandas, NumPy, Matplotlib, Seaborn, Plotly, and scikit-learn.
Topics include: descriptive statistics (mode, median, mean), probability theory (conditional probabilities, Kolmogorov axioms), random variables, distributions and expectation, correlation and covariance, sampling and the central limit theorem, linear and polynomial regression, least squares and regularization, as well as vector/matrix operations in NumPy and data visualization.
Who it suits and who it does not: mathematics and statistics for Data Science
Suitable for
- Those familiar with basic Python who want to apply statistical methods to real datasets.
- Analysts and developers working with visualization, regression, and hypothesis testing.
- STEM students needing a structured foundation in mathematics and statistics for Data Science.
Not suitable for
- Those who do not plan to work with Python or data analysis libraries.
- Users seeking a purely theoretical course without Jupyter Notebook practice.
Problem → analytical outcome in Data Science with Python
- Inaccurate sampling → consistent selection methods and use of the central limit theorem.
- Difficulty with hypothesis testing → proper H0/H1 setup, p-values, and test criteria.
- Poor understanding of correlation/covariance → sound interpretation of relationships.
- Regression challenges → building linear/polynomial models, regularization, error assessment.
- Large datasets → vectorized NumPy operations and efficient Pandas pipelines.
Comparison with alternatives: textbooks, video lectures, and self-study
- Textbooks: strong theory but limited notebooks; here the focus is Python application.
- Standalone video lectures: selective topics; here a path from descriptive stats to models.
- Self-study: flexibility with uneven coverage; here aligned tools Pandas/NumPy/sklearn.
Outcomes of study: statistics and mathematics for Data Science
- Practical use of Jupyter Notebook and basic data structures in Python.
- Descriptive statistics and visualizations in Matplotlib and Seaborn, interactive plots in Plotly.
- Work with samples, distributions, expectation, and variance.
- Hypothesis testing and interpretation of p-values.
- Building and validating regression models in scikit-learn, with regularization.
- Vector and matrix operations in NumPy for computational tasks.